1. Loading & Editing Maps
The first step in creating your custom map is selecting and loading the base map data. PaintMyMap offers multiple ways to get started, whether you want to use our built-in maps or upload your own data.
Quick demo: Load a map, change projection and set color theme.
Built-in Maps
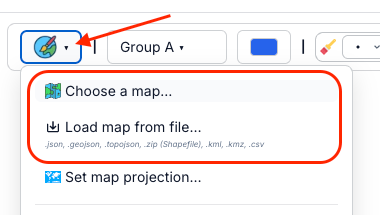
Use the menus in the top toolbar to choose from our collection of predefined maps. Open the File menu and pick “Choose a map…”. The lists are organized by region and detail level.
World Maps
Explore world and continent maps, with different levels of detail. Note: detailed maps download more data and may load slower.
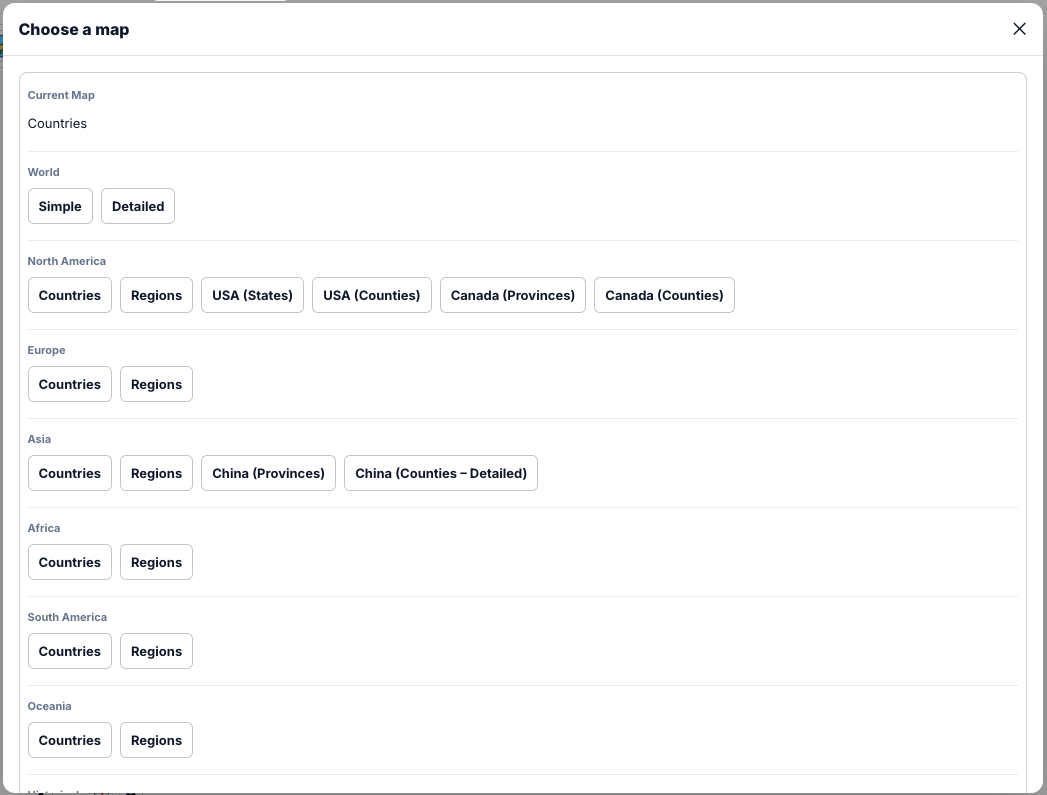
See the complete list in Maps.
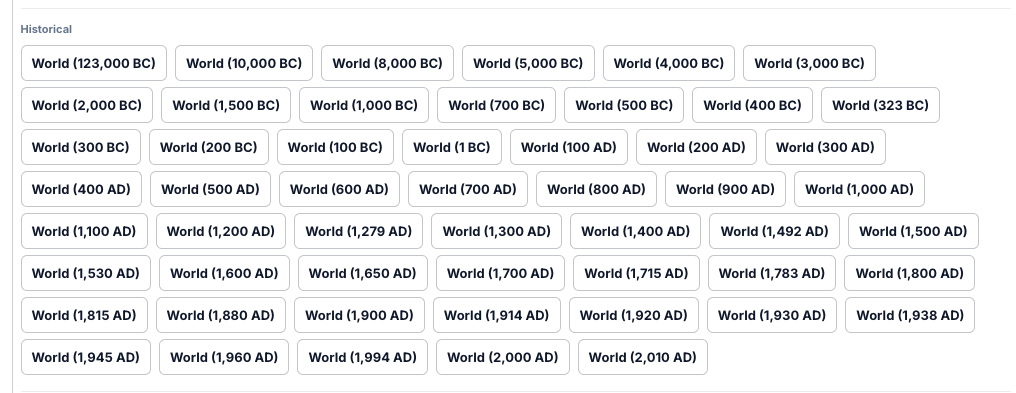
Historical Maps
Paint and customize maps across different time periods (from deep prehistory to present day). Note: some datasets may be approximate; for authoritative data, see “Load your own data” below.
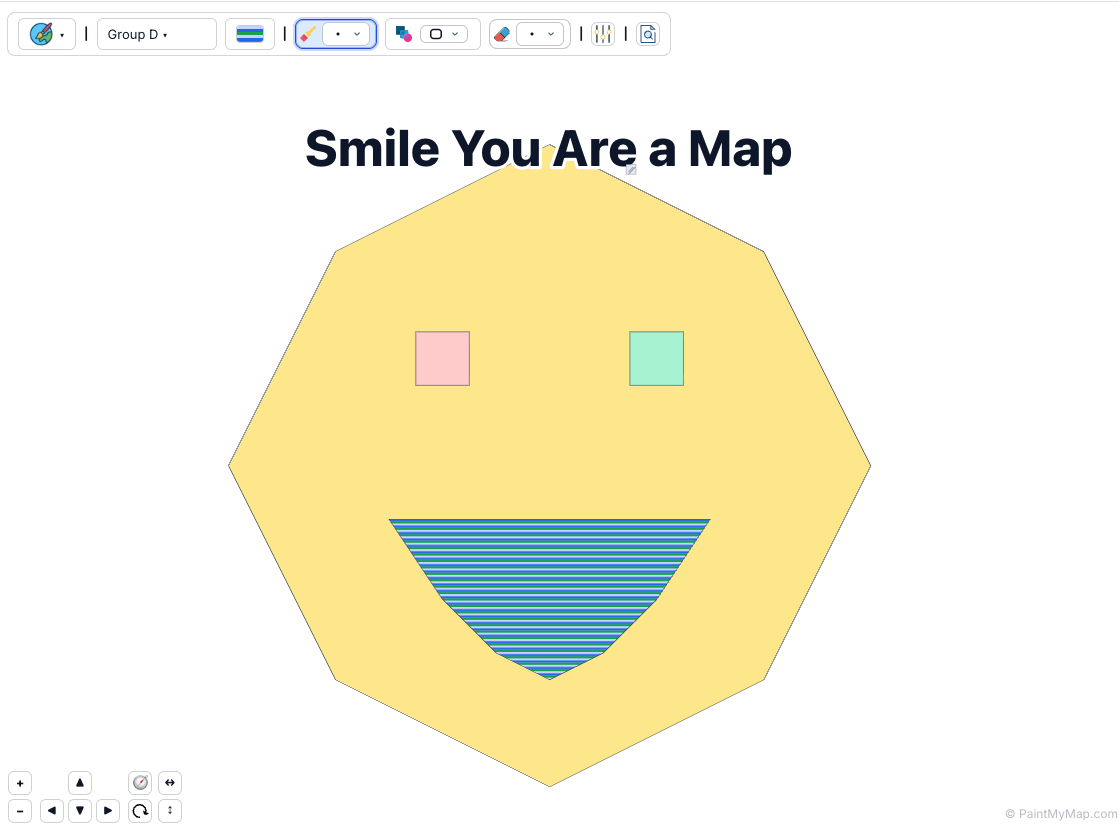
Fun Maps
Creative, fictional datasets (like the Smiley Face map) show you can load any data and paint it. It doesn’t have to be geographically accurate—perfect for demos and playful projects.
Load Your Own Data
For complete customization, upload your own geographic data files:
Supported Formats
- GeoJSON (.json, .geojson) — most common and recommended
- TopoJSON (.topojson) — compressed GeoJSON format
- Shapefile (zipped) (.zip) — include .shp, .dbf, .prj, .shx inside the ZIP
- KML/KMZ (.kml, .kmz) — Google Earth formats
- CSV (.csv) — coordinates or region identifiers
How to Load a File
- Open the File menu and click Load map from file…
- Select a supported file from your computer
- PaintMyMap detects the format and loads your data
- Your custom map appears on the canvas
To show country/region labels, each feature should include a properties.name (or name_en). For an explicit label anchor include label_node_lat and label_node_lng.
Example (truncated geometry):
json
{
	"type": "FeatureCollection",
	"features": [
		{
			"type": "Feature",
			"geometry": { "type": "MultiPolygon", "coordinates": [[[ ...]]]},
			"properties": {
				"name": "Sri Lanka",
				"name_en": "Sri Lanka",
				"label_node_lat": 7.5554942,
				"label_node_lng": 80.7137847
			}
		}
	]
}
Best practices:
- Use WGS84 (EPSG:4326) coordinates.
- Prefer
MultiPolygon/Polygongeometries.GeometryCollectionis supported but each sub‑geometry is processed separately which can:- Fragment borders (hairline gaps or overlaps)
- Produce duplicate / overlapping labels
- Increase transform + export cost Merge related pieces into a single (Multi)Polygon beforehand when possible.
- Merge fragmented geometry into a single MultiPolygon for cleaner labeling and simpler selection.
Map Editor Mode (Optional Structural Edits)
Most users won’t need to alter the base geometry. When you do, Map Editor Mode will let you manipulate features directly.
Move, rotate, resize and delete regions in Map Editor Mode
How to Edit a Map
- Open File → Map Editor Mode
- Click a country / region feature to select it (selection outline + handles appear).
- Move: drag the selected feature.
- Rotate: press R while selected or use the rotate handle / UI control.
- Resize: drag a corner handle (hold Shift to preserve aspect ratio where applicable).
- Delete: press Backspace / Delete or use the Delete button in the UI.
- Multi‑select: Shift+Click additional features (or drag a marquee while holding Shift) then delete as a group.
Notes & Performance
- Transformations occur after projection; they do not “true size” normalize area (Mercator size exaggerations remain). If you drag Greenland over Africa in Mercator it will still look vastly larger (though it's ~14–16× smaller in reality).
- Need accurate true‑size comparative layouts? Use a specialized true size country tool like: https://guesswhereyouare.com/guide/maps/true-country-size.html — it lets you move countries with preserved area and export GeoJSON; then import that GeoJSON here.
- Exported state (Project JSON) includes these transforms so reloading reproduces your layout.
- Excessive transforms on very high‑detail datasets (e.g. world‑detailed + many rotations) can increase export size and slow undo/redo; consider simplifying before heavy edits.
Map Projections
After loading your map, choose from popular cartographic projections:
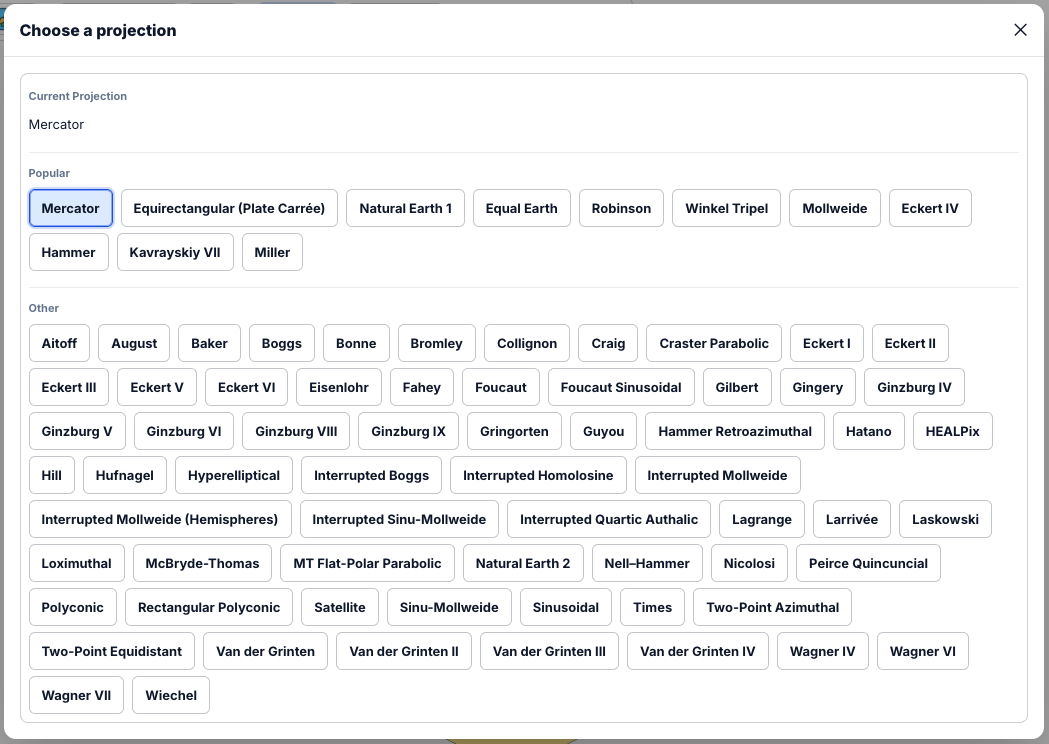
Popular Projections
- Mercator — traditional rectangular projection (good for navigation)
- Robinson — compromise projection balancing size and shape
- Winkel Tripel — used by National Geographic (balanced distortion)
- Natural Earth — minimal distortion for thematic maps
Projection examples:
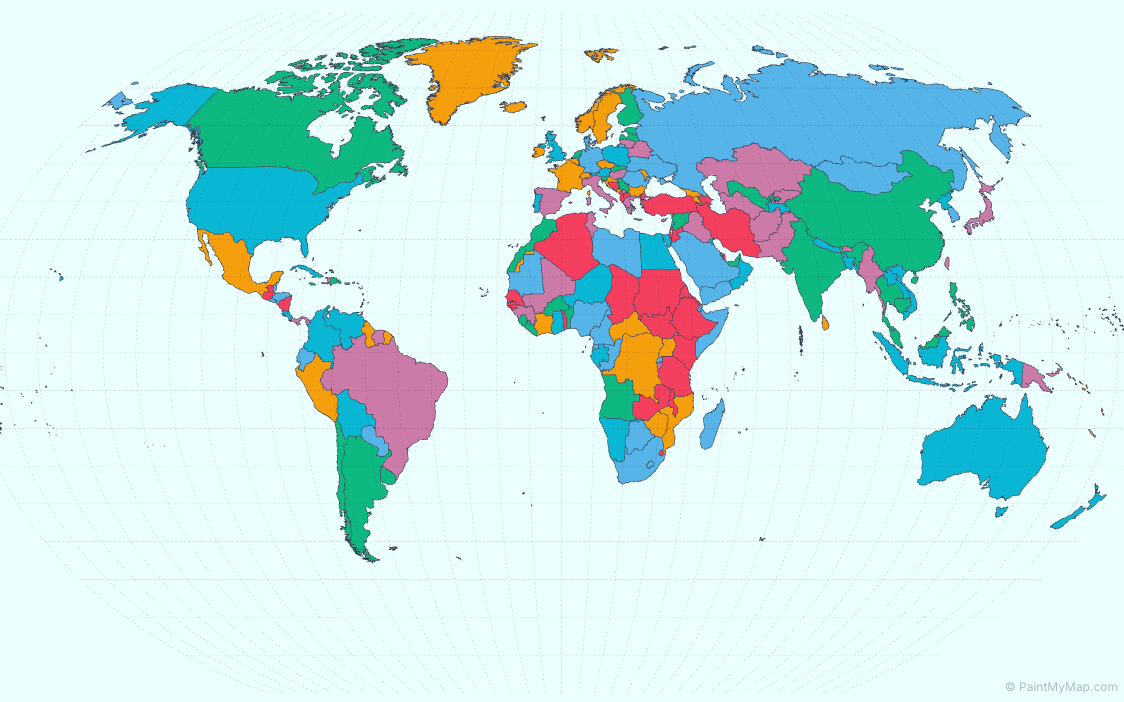
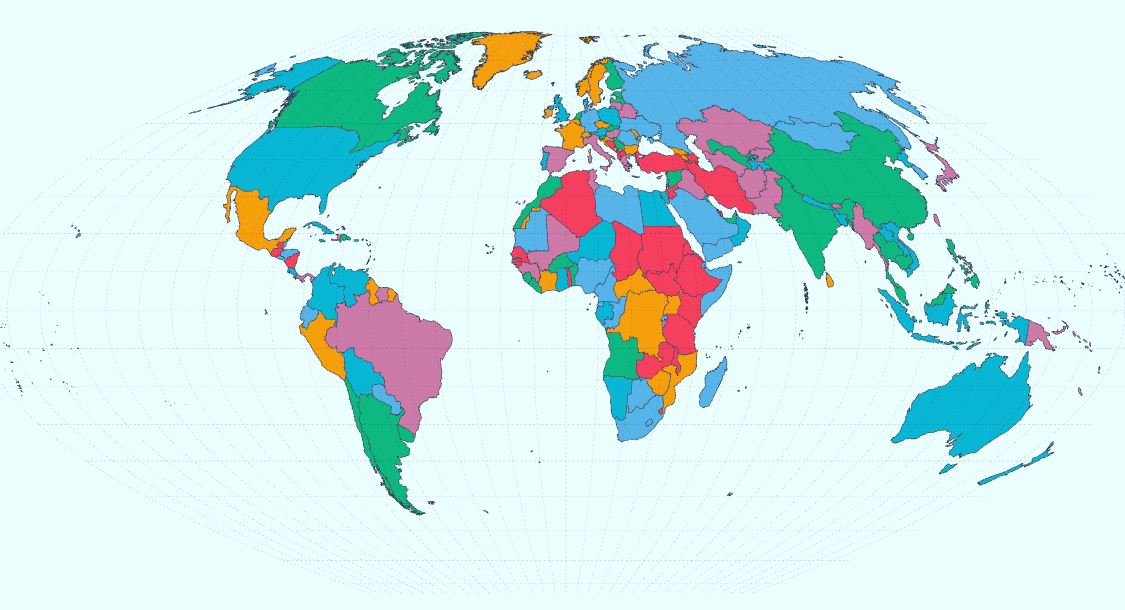
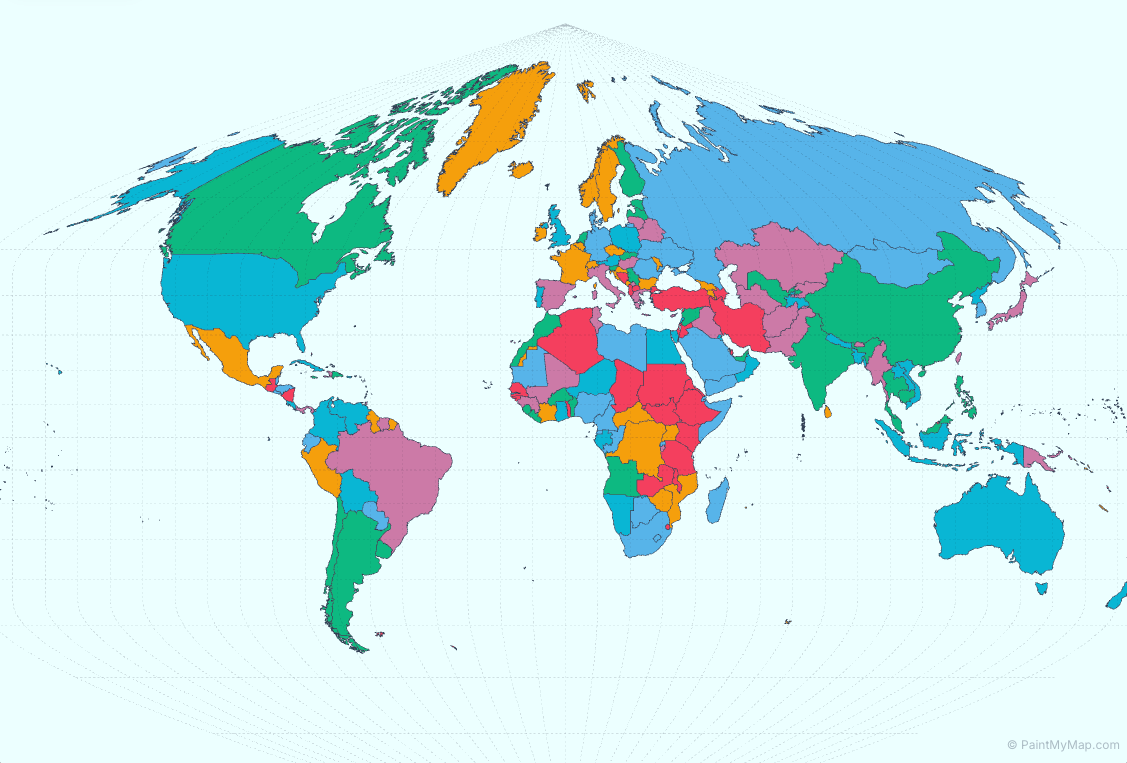
Changing Projections
- Open the Projection control in the toolbar
- Select your preferred projection
- The map updates to the new projection
- All your painting and customization remain intact
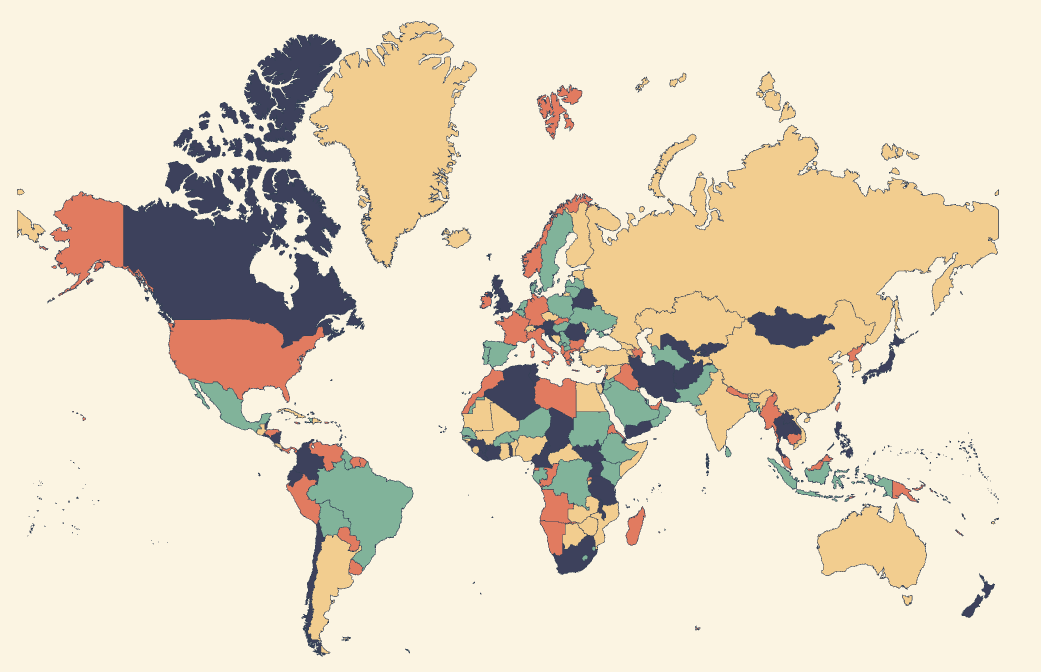
Color Themes
Explore color themes to jump‑start your design:
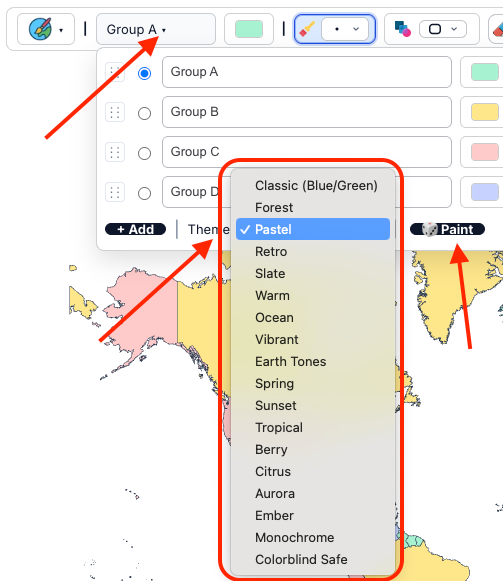
Applying Themes
- Use the Theme dropdown near the legend
- Select a theme to apply it instantly
- Themes set the background and provide starting colors for your legend
Available Themes (examples)
- Classic — balanced and clean
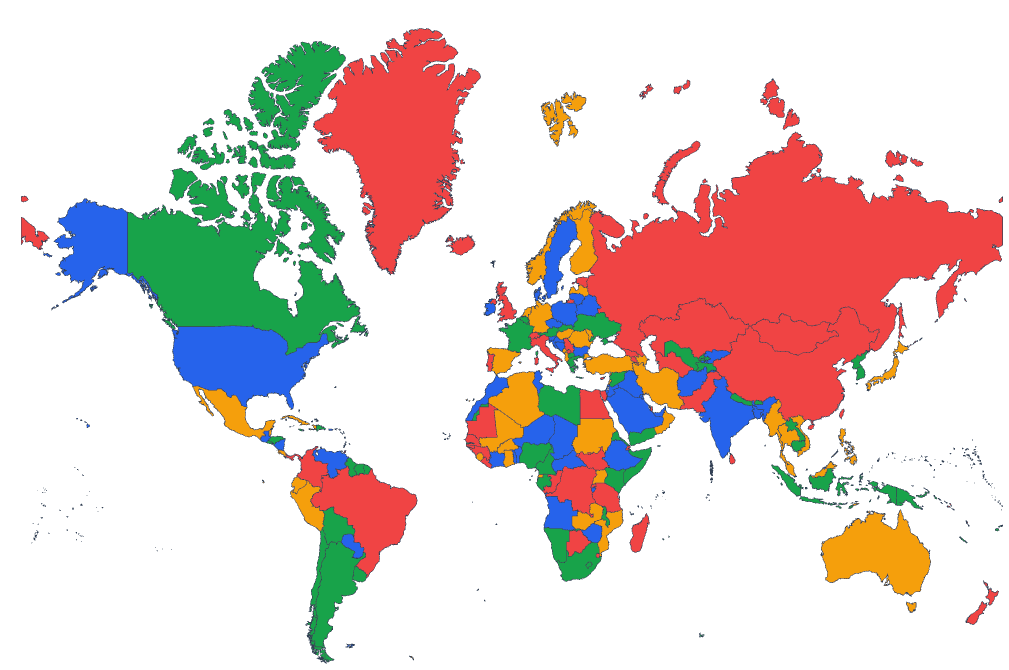
- Color‑blind safe — accessible palette
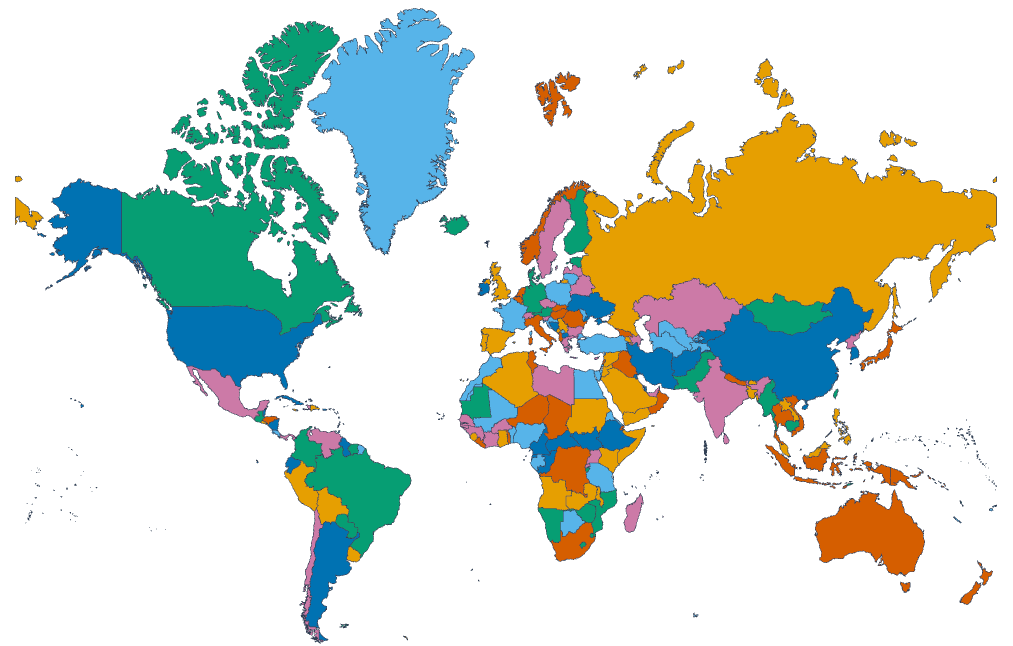
- Forest — earthy greens
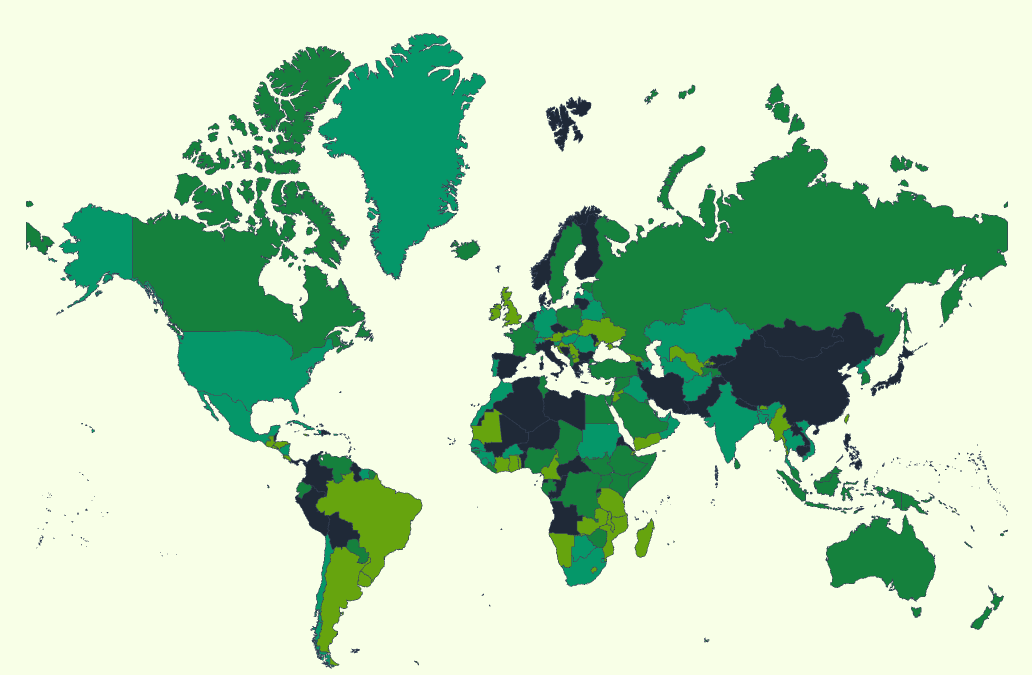
- Pastel — soft and friendly
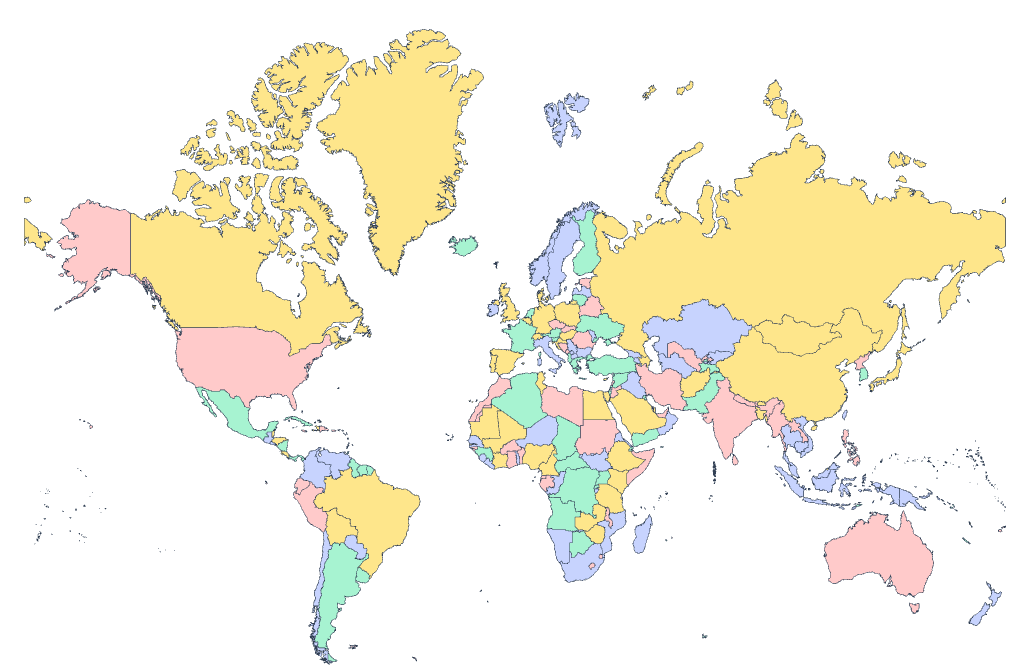
- Retro — bold vintage tones
 ...and many more
Next Steps
Once your map is loaded, you're ready to start painting! Continue to the next section to learn about customizing and painting your map regions.